Now Reading: Comprehensive Guide to Creating Effective Sequence Diagrams
-
01
Comprehensive Guide to Creating Effective Sequence Diagrams
Comprehensive Guide to Creating Effective Sequence Diagrams
Sequence diagrams are essential tools for visualizing and understanding the interactions between objects in a system over time. They provide a clear and concise way to represent how processes communicate, making them invaluable for system design and analysis. This guide will walk you through the key elements of a sequence diagram and provide practical tips for creating effective diagrams. Additionally, we will highly recommend Visual Paradigm as a top-tier UML tool for creating sequence diagrams.
Key Elements of a Sequence Diagram

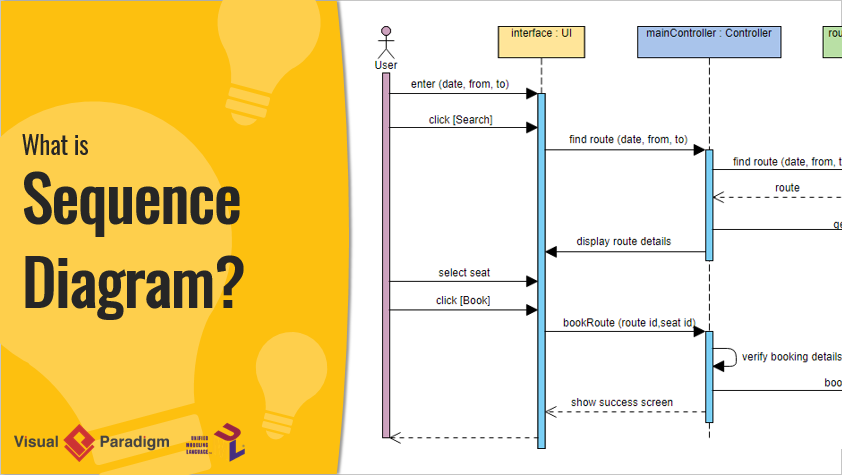
1. Lifelines
Lifelines are vertical lines that represent the processes or objects involved in the interaction. Each lifeline corresponds to an object or actor and is typically labeled at the top with the object’s name. Lifelines show the existence of objects over time and are crucial for understanding the sequence of interactions.
- Example: In a customer support system, lifelines might represent the customer, the support agent, and the database.
2. Messages
Messages are horizontal arrows that show the interactions between lifelines. They can be synchronous (solid arrowhead), asynchronous (open arrowhead), or return messages (dashed line). Messages indicate the flow of control and data between objects.
- Message Types:
- Synchronous Messages: Represent calls that require a response before proceeding.
- Asynchronous Messages: Represent calls that do not require an immediate response.
- Return Messages: Indicate the return of control or data to the caller.
3. Activation Boxes
Activation boxes are rectangles drawn on lifelines to indicate the execution of processes in response to messages. They represent the time during which an object is performing an operation. Activation boxes help visualize the active periods of objects.
- Example: An activation box on the support agent’s lifeline shows the duration of handling a customer request.
4. Actors
Actors are external entities that initiate interactions with the system. They are often represented by stick figures or actor symbols. Actors represent users or other systems that interact with the system being modeled.
- Example: In an e-commerce system, actors might include customers, administrators, and payment gateways.
5. Interaction Fragments
Interaction fragments are used to model complex interactions such as alternatives, options, and loops. They are represented by frames with specific operators (e.g., alt for alternatives, opt for options, loop for repetitions). Interaction fragments help capture conditional behavior and repetitive processes.
- Example: An interaction fragment with an “alt” operator can show different paths based on a condition, such as successful or failed login attempts.
6. Diagram Frames and Gates
Frames provide a boundary for the diagram and can include labels. Gates are used to show where messages enter or leave the diagram. Frames and gates help organize the diagram and make it easier to understand the scope of interactions.
- Example: A frame labeled “Customer Support Interaction” can encompass all messages and lifelines related to handling customer inquiries.
7. Return Values
Include return values associated with messages to show the outcome of interactions. Return values help trace the flow of data and understand the results of operations.
- Example: A return message from a database query might include the retrieved data or an error code.
8. Sequence Numbers
Optionally, sequence numbers can be added to messages to clarify the order of interactions. Sequence numbers help ensure that the sequence of events is clear and unambiguous.
- Example: Messages can be labeled with numbers (e.g., 1.1, 1.2) to indicate the order of operations within a specific interaction.
Practical Tips for Creating Effective Sequence Diagrams
1. Keep It Simple
Avoid overcrowding the diagram with too many details. Focus on the key interactions and processes relevant to the scenario being modeled.
2. Use Clear Labels
Label lifelines, messages, and activation boxes clearly and concisely. Use descriptive names that make the diagram easy to understand.
3. Maintain Consistency
Use consistent notation and styles throughout the diagram. This helps ensure that the diagram is easy to read and interpret.
4. Include Comments
Add comments or notes to explain complex interactions or provide additional context. This can help clarify the diagram for stakeholders who may not be familiar with the system.
5. Review and Validate
Regularly review the diagram with stakeholders to ensure accuracy and completeness. Validate the diagram against the system requirements and use cases.
Sequence Diagram Example
The following sequence diagram illustrates the process of making a reservation in a hotel booking system. It includes key elements such as lifelines, messages, activation boxes, interaction fragments, and loops. Here’s a detailed explanation of the diagram:
Key Elements and Flow:
-
Lifelines:
- window: UI: Represents the user interface through which the user interacts with the system.
- sChain: HotelChain: Represents the hotel chain system that manages multiple hotels.
- aHotel: Hotel: Represents an individual hotel within the chain.
-
Messages:
- 1: makeReservation: This message is sent from the user interface (window: UI) to the hotel chain system (sChain: HotelChain) to initiate the reservation process.
- 1.1: makeReservation: This message is forwarded from the hotel chain system to the specific hotel (aHotel: Hotel) to handle the reservation request.
- 1.1.1: available(roomId, date): isRoom: This self-message within the hotel (aHotel: Hotel) checks the availability of a room for the specified date.
- 1.1.2: aReservation: Reservation: This create message is sent to create a reservation object if a room is available.
- 2: aNotice: Confirmation: This message is sent to generate a confirmation notice after the reservation is successfully created.
-
Activation Boxes:
- The activation boxes on the lifelines of sChain: HotelChain and aHotel: Hotel indicate the periods during which these objects are actively processing the reservation request.
-
Interaction Fragments:
- Loop (loop): The loop fragment indicates that the availability check (1.1.1: available(roomId, date): isRoom) is performed for each day in the specified date range.
- Alternative (alt): The alternative combined fragment (if) specifies that the reservation is only created if a room is available (isRoom = true).
-
Self Message:
- The self-message 1.1.1: available(roomId, date): isRoom within the hotel (aHotel: Hotel) represents an internal check for room availability.
-
Create Message:
- The create message 1.1.2: aReservation: Reservation is used to instantiate a new reservation object when a room is available.
-
Stopped Lifeline:
- The stopped lifeline at the end of the diagram indicates the termination of the process after the confirmation notice is generated.
Flow of Interactions:
- The user initiates the reservation process through the user interface (window: UI).
- The user interface sends a makeReservation message to the hotel chain system (sChain: HotelChain).
- The hotel chain system forwards the makeReservation message to the specific hotel (aHotel: Hotel).
- The hotel checks the availability of the room for each day in the specified date range using a loop.
- If a room is available (isRoom = true), a reservation object is created.
- A confirmation notice is generated and sent.
- The process terminates after the confirmation notice is generated.
This sequence diagram effectively captures the interactions and conditional logic involved in making a hotel reservation, providing a clear visual representation of the system’s behavior.
Highly Recommended Tool: Visual Paradigm
Visual Paradigm is a comprehensive and versatile UML tool that is highly recommended for creating sequence diagrams. Here’s why it stands out:

Comprehensive UML Support
Visual Paradigm supports all 14 UML 2.x diagram types, including sequence diagrams, making it a one-stop solution for complete system modeling. This is ideal if you’re working on complex projects requiring multiple diagram types12.
Intuitive Sequence Diagram Editor
Its drag-and-drop interface, combined with features like Resource Catalog, sweeper, and magnet tools, makes creating and editing sequence diagrams fast and precise. For example, you can easily add messages or adjust spacing without tedious manual adjustments34.
Collaboration and Team Features
It offers team collaboration tools, version control, and the ability to publish diagrams online for feedback. This is a big plus if you’re working with others or need stakeholder input4.
Code Engineering
Visual Paradigm can generate sequence diagrams from existing Java code (reverse engineering) and produce code stubs from diagrams (forward engineering). This bridges the gap between design and implementation, saving time for developers4.
Cross-Platform Availability
It works on Windows, macOS, and Linux, ensuring flexibility regardless of your operating system4.
Free Community Edition
For non-commercial use or learning purposes, the Community Edition provides access to core UML features, including sequence diagrams, with no time limits or ads—though it includes a watermark on outputs4.
Additional Features
Beyond UML, it supports BPMN, ERD, ArchiMate, and more, plus extras like report generation and cloud architecture design. This makes it a powerful tool for broader system design needs4.
Conclusion
Sequence diagrams are invaluable for visualizing and understanding system interactions. By including key elements such as lifelines, messages, activation boxes, actors, interaction fragments, diagram frames, return values, and sequence numbers, you can create effective and clear sequence diagrams. Visual Paradigm is a top-tier UML tool that provides the features and capabilities needed to create high-quality sequence diagrams efficiently. Whether you are a beginner or an experienced professional, Visual Paradigm offers the tools and support to enhance your system design and analysis processes.
